The Web Dashboard
orchstep serve - a local-first web UI to run tasks on click, watch a live execution graph and streaming logs over SSE, browse run history, inspect any step, and switch between workflows. No install, no infra.
One static binary, no database to stand up, no signup. It binds to
127.0.0.1, embeds the entire UI, and keeps run history in a single SQLite file under.orchstep/.
You already have an orchstep.yml. orchstep serve turns it into a small
control panel in your browser: every task is a button, every run streams its
logs and lights up a live execution graph, you can inspect any step's runtime
context, preview the resolved plan before running, and the history is right
there. Think GoCD or Jenkins or Argo, minus the cluster, the YAML-of-YAML, and
the afternoon of setup.
This dashboard has a name — OrchStep Pipeline — but it is deliberately a
second-class citizen: a companion to the orchstep command line, never a
replacement for it. The CLI is the product — scriptable, CI-friendly,
agent-friendly, no browser required. OrchStep Pipeline is the optional layer on
top for when you'd rather click, watch, and inspect. Everything here maps to a
CLI command, and the run builder prints the exact orchstep run … for every
launch, so nothing you do in the browser is locked to the browser.
cd your-project        # the dir with orchstep.yml
orchstep serve # -> http://127.0.0.1:7777That is the whole setup. No serve.yaml, no agents, no Postgres.
A 60-second tour of OrchStep Pipeline — running a task, the live graph, the pretty logs, and inspecting a step:
Want something to run right now? The screenshots on this page come from the ready-to-run example projects in github.com/orchstep/orchstep-demos. Clone it,
cdintoserve-multi-envs/(the external-env example) orserve-task-calls/(a pipeline that calls task files), and runorchstep serve.
The dashboard at a glance
The left rail is your project as a tree: the workflow's inline tasks, any
discovered task files under tasks/, the environments (defaults, groups, and
per-env leaves), and the dotenv files. Pick a task and the main pane opens a row
of tabs over it.
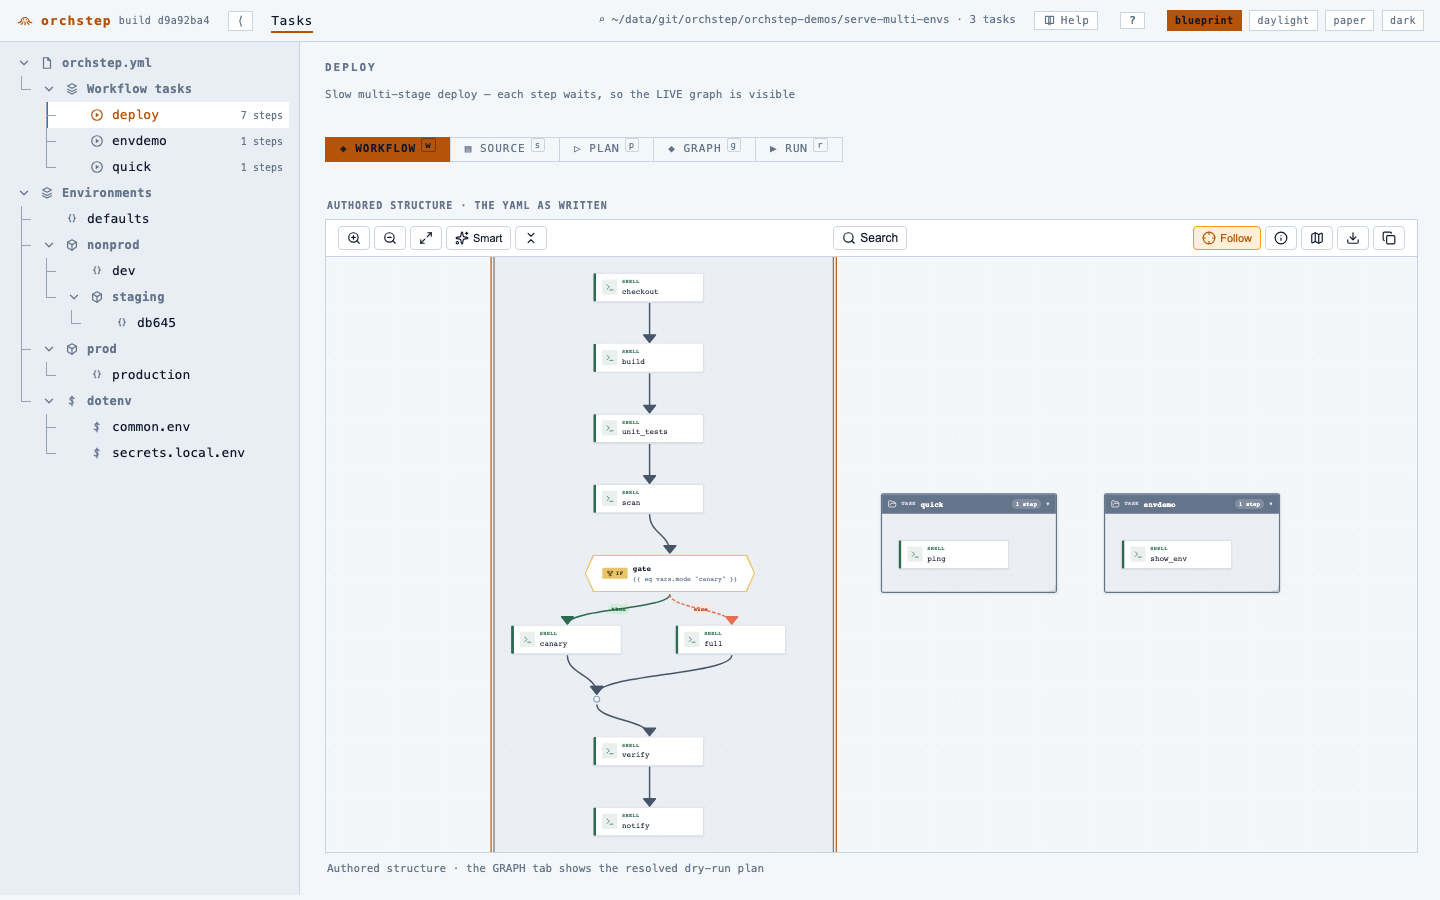
Four themes live in the top-right (blueprint, daylight, paper, dark) and the
whole UI - graphs included - re-themes together. Paths are shown relative to
your home directory (~/…) so a screen-share or a screenshot never leaks your
username. Everything is keyboard-driven; press ? for the full list.
The five tabs over a selected task:
| Tab | Key | What it shows |
|---|---|---|
| WORKFLOW | w | The authored structure - the YAML as written, as a graph. |
| SOURCE | s | The underlying YAML, with a block / flow toggle. |
| PLAN | p | The resolved dry-run plan as a lane view. |
| GRAPH | g | The resolved dry-run plan as an interactive graph. |
| RUN | r | The integrated run console: configure, launch, watch, history. |
Reading the source: block vs flow
The SOURCE tab renders the task's YAML, gutter-highlighting the lines that belong to the selected task. A block / flow toggle reformats it two ways, so the toggle is always useful no matter how the file was written:
# block - every map and list expanded line by line
steps:
  - name: do_build
    task: build
  - name: do_test
task: test# flow - leaf maps and lists inlined as {…}/[…] (the compact, JSON-like style)
steps:
- {name: do_build, task: build}
- {name: do_test, task: test}Both are generated from the parsed YAML and comments are preserved, so you can read a hand-written compact file expanded, or read a verbose file inline.
Configuring a run
Open the RUN tab and you get three sub-tabs - Config, Execution,
History (keys f, u, h) - with the green Run action always at the
right.
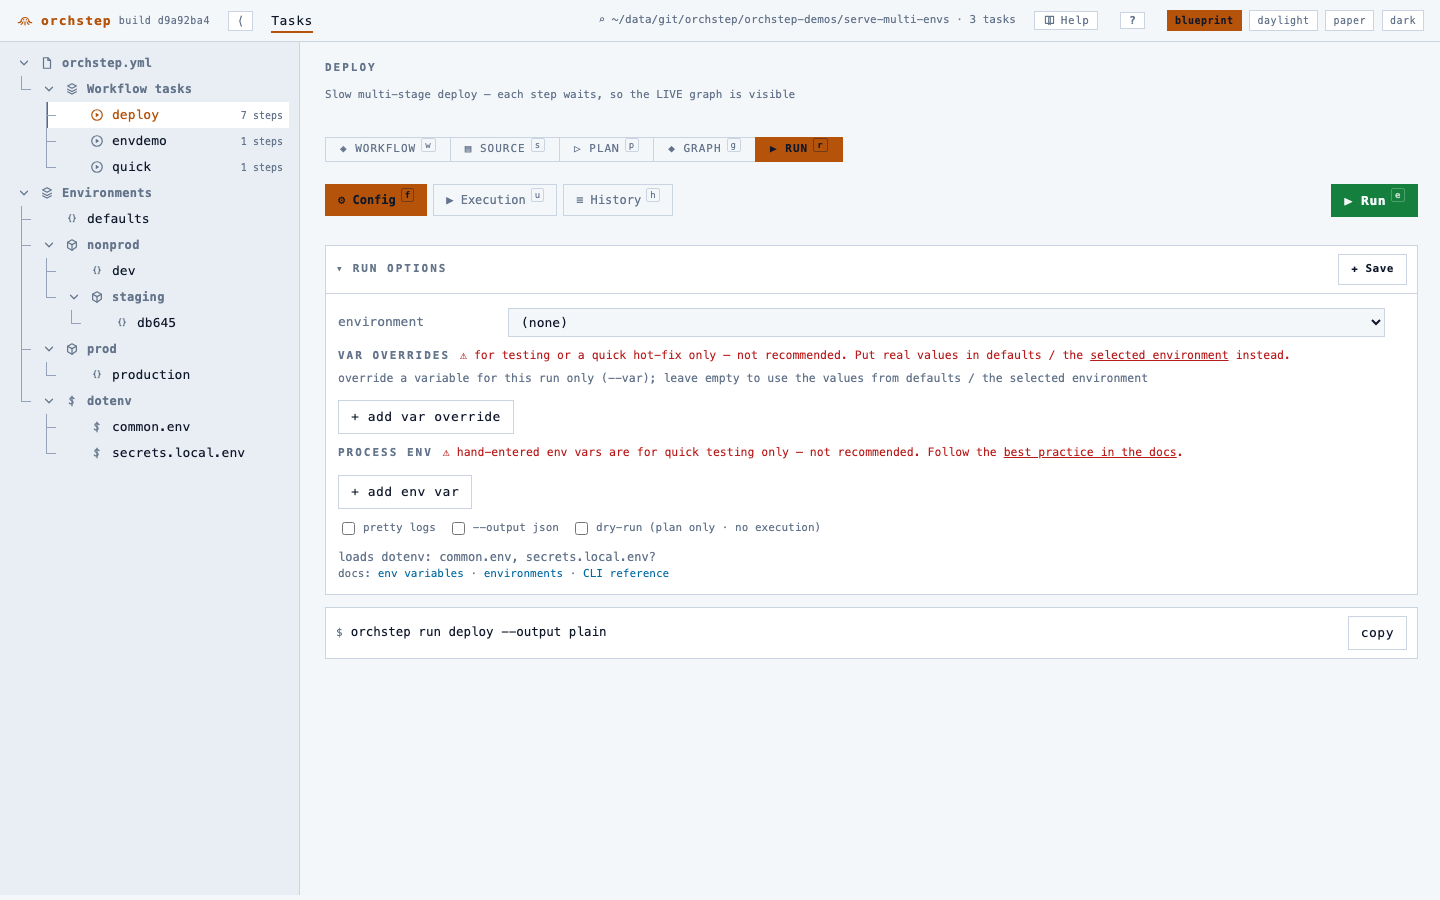
Config is the run builder:
- Environment - pick a
--env(group or leaf); the dropdown is populated from your declared environments and the externalenvironments/hierarchy. - Var overrides - override a variable for this run only (
--var). This is for a quick test or hot-fix; real values belong indefaultsor the selected environment, so the field carries a caution. - Process env - set ad-hoc OS env vars for the run (also caution-flagged - not recommended for real values).
- Output -
pretty,plain, orjson. - Dry run - flip it on and Run opens the PLAN instead of executing.
A live command preview shows the exact orchstep run … the dashboard will
execute, with a copy button - so anything you do here is reproducible from a
terminal or a CI job.
Watching a run: the live graph
Press Run and you land on Execution. The left rail is the step list with a
live status glyph and a duration; the main pane has two views, LOG and
LIVE (keys o and i), over one SSE stream.
The LIVE graph draws the task's whole pipeline up front and lights each node straight from the event stream: queued nodes dim, the running node pulses amber, done nodes go green, a failure goes red. The camera follows the active step at your chosen zoom, so on a big pipeline you always see what is running now.
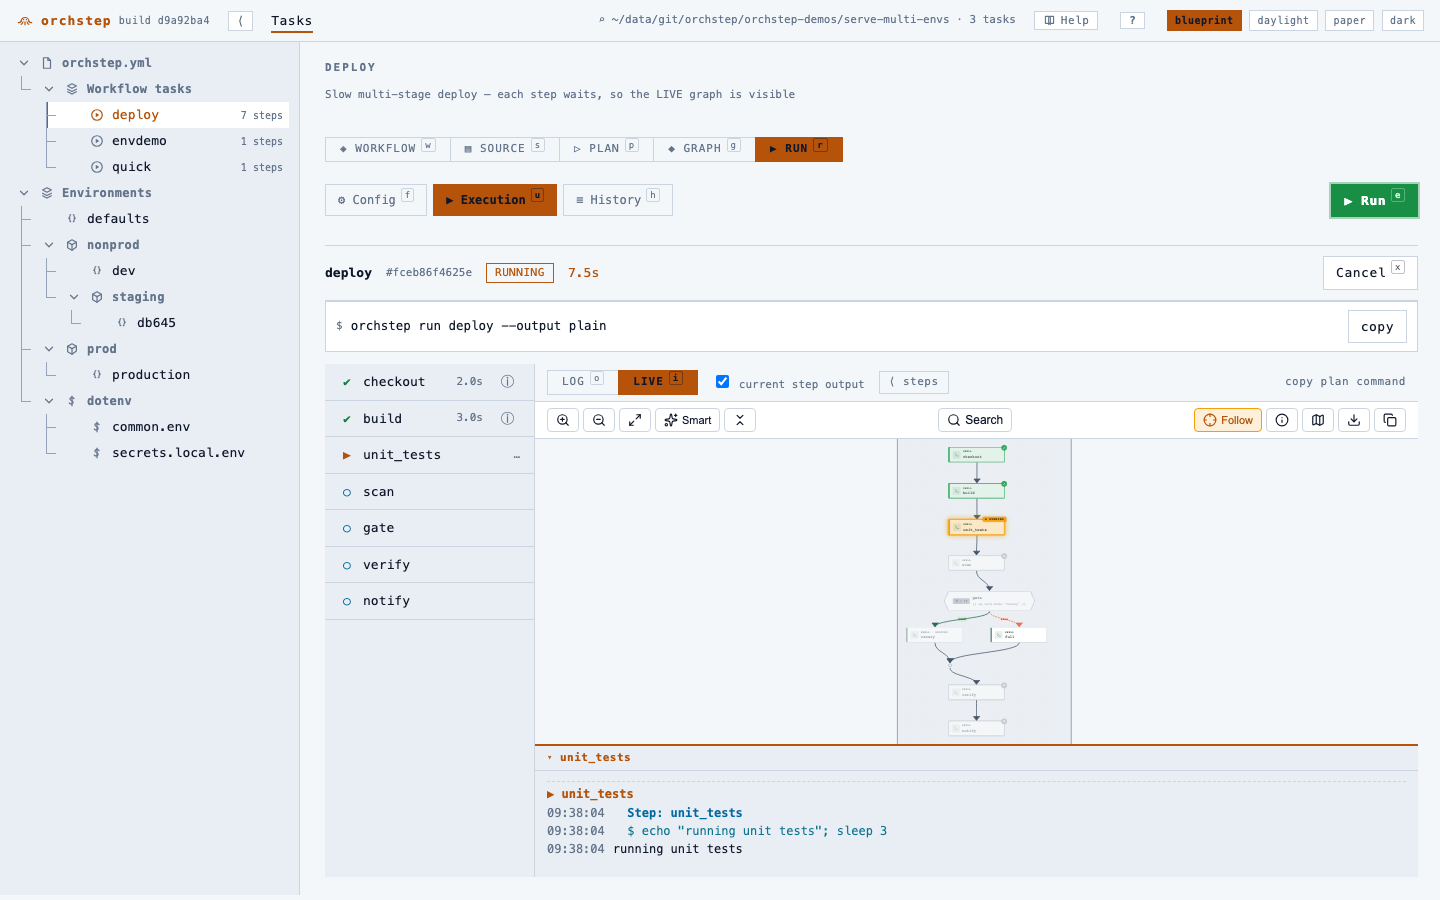
It descends into called task files too: when a step calls another task, the graph lights up that task's inner steps as the run enters it, so you watch the whole chain, not just the top level. A conditional always lays its branches out the same way - the then arm first (left in vertical, top in horizontal), the else arm second - and only the arm that actually runs lights up.
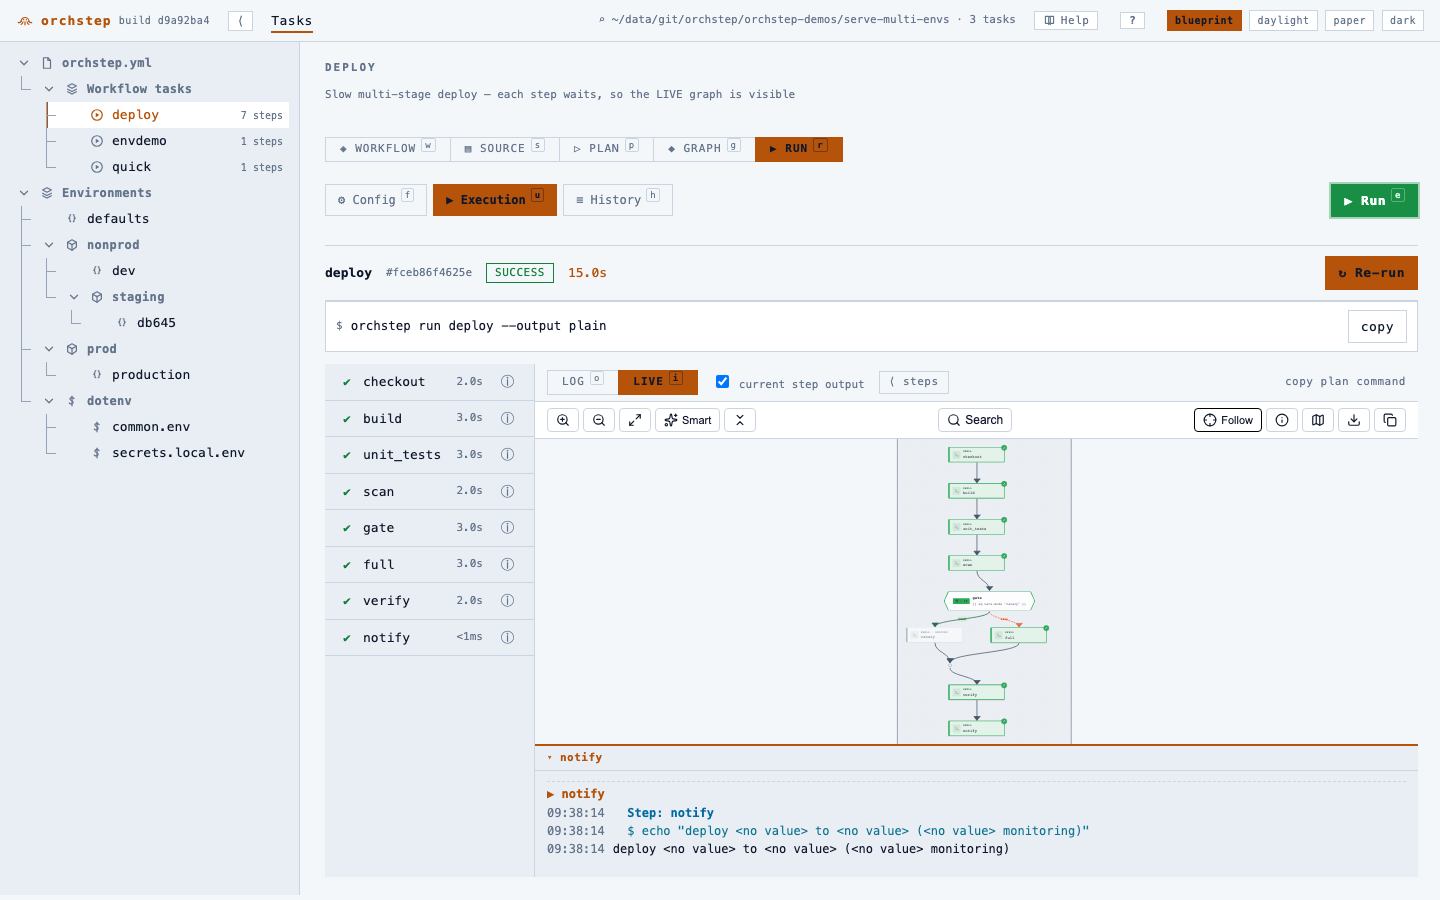
When the run finishes it frames the whole graph so you see the complete result - the taken branch green, the skipped branch dimmed:
A few controls on the LIVE toolbar:
- Smart / Vertical / Horizontal - the layout direction. Your choice sticks across re-runs; so does your zoom.
- Follow - toggle the follow-the-active-step camera off for free exploration. Zoom in to read a node, zoom out for the overview - your size is kept.
- ⟨ steps and the current step output tick - collapse the step rail or the streaming-output panel to give the graph the full canvas.
Watching a run: the log
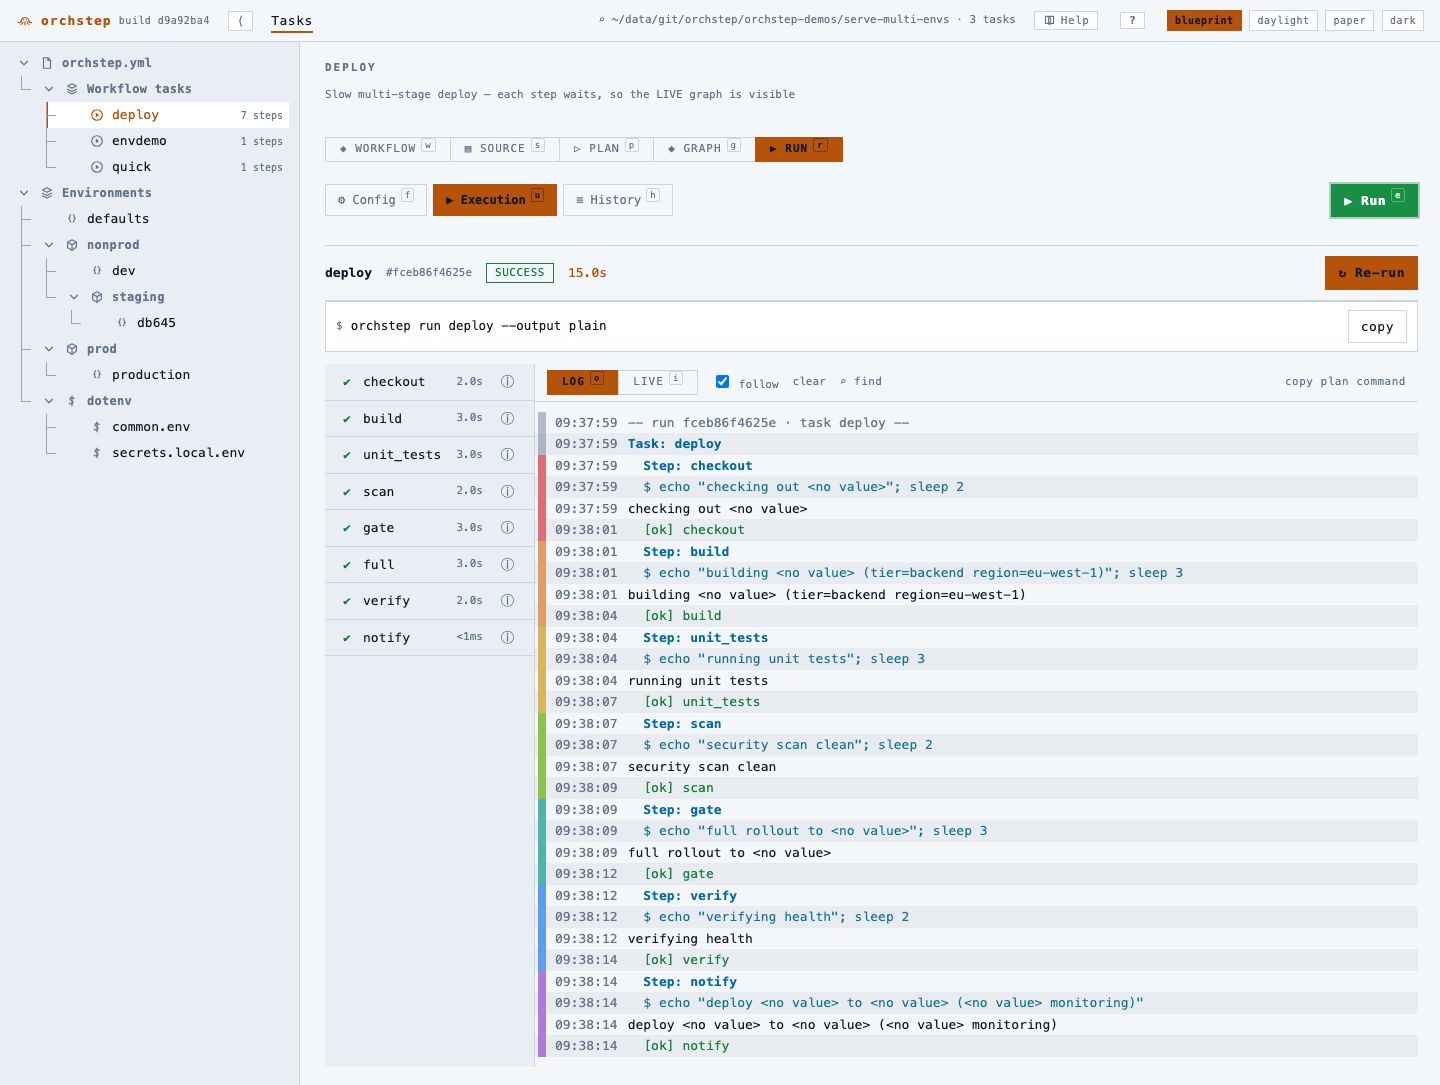
The LOG view streams stdout, stderr, and step transitions as they happen,
over Server-Sent Events
(plain HTTP, no websockets). Follow pins it to the newest line; ⌘/Ctrl-F
searches the buffer and jumps to the next failure; Cancel (or x) stops a
running task mid-flight.
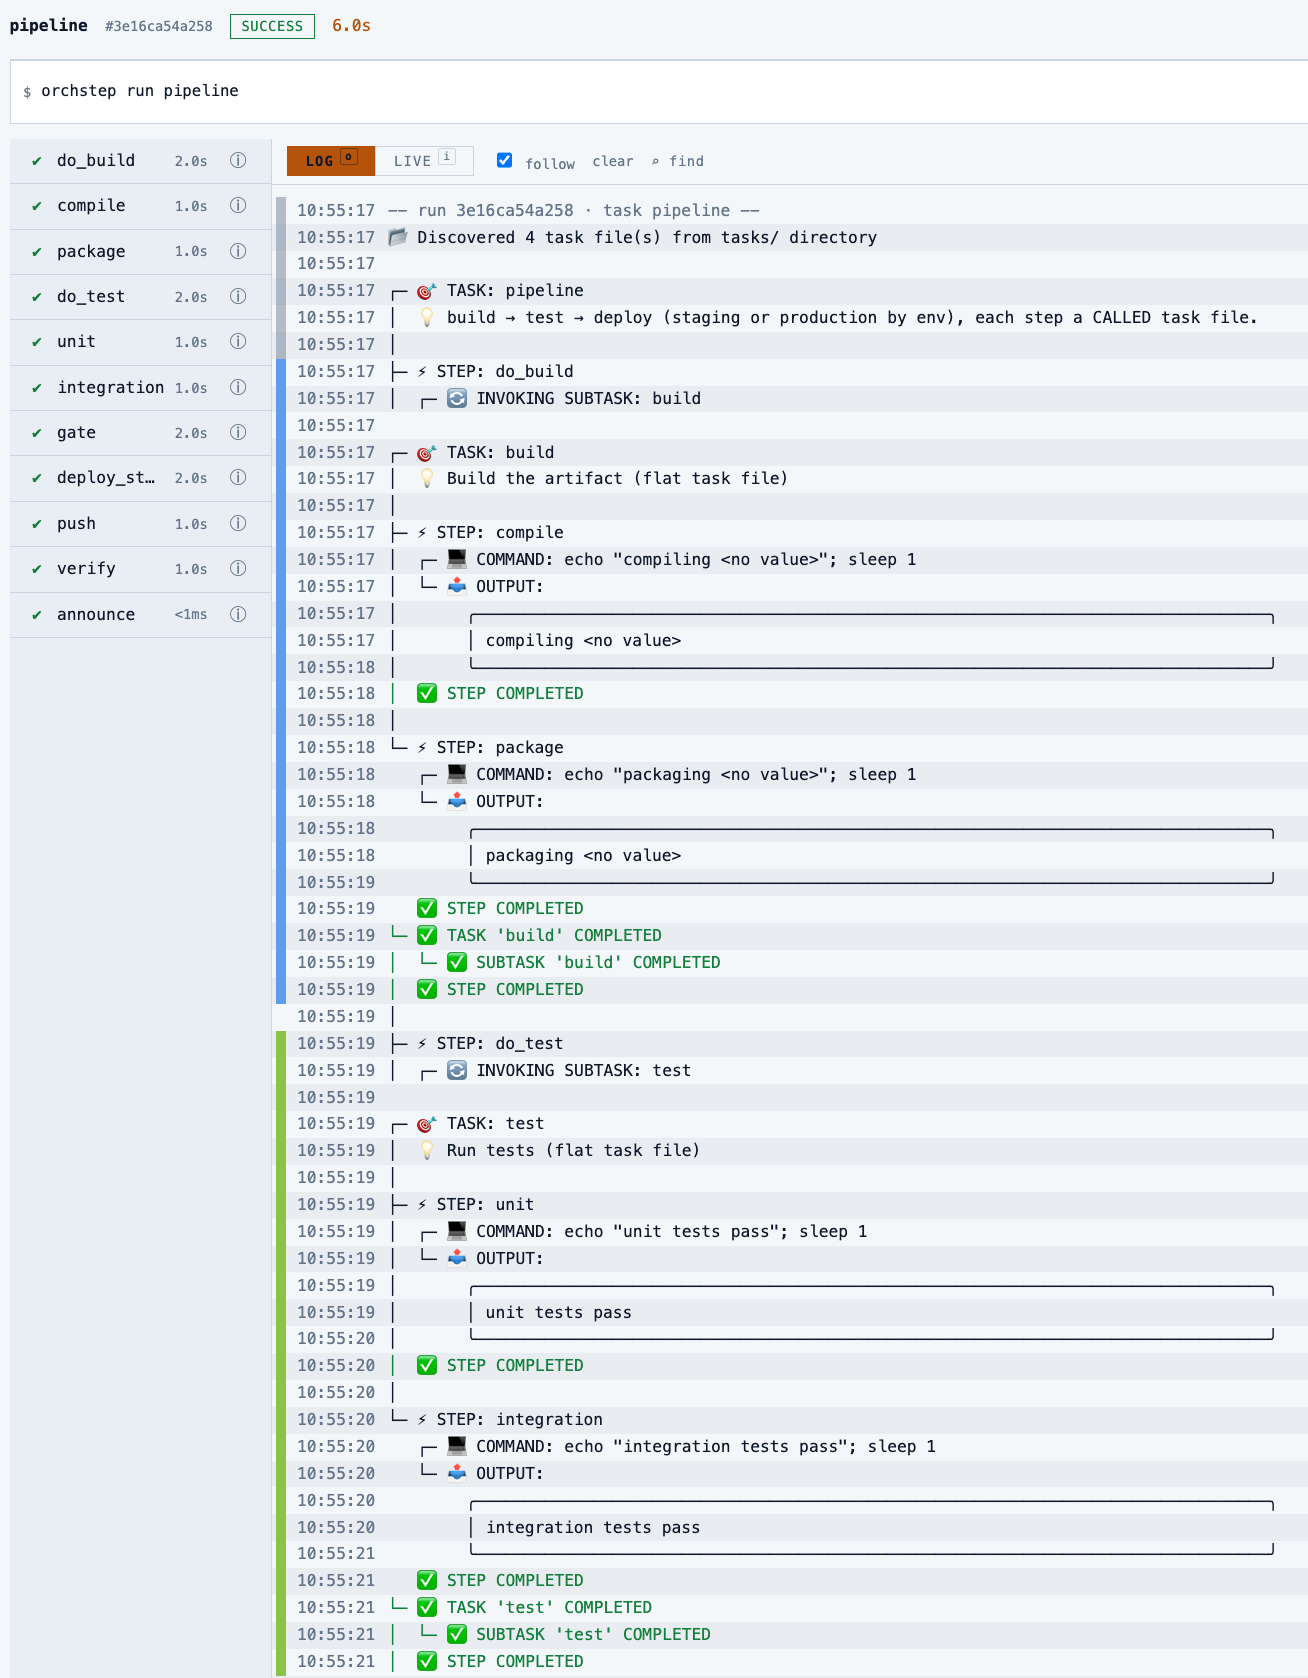
A colored gutter runs down the left of the log, one band per top-level step, so
a long run is easy to scan. When a step calls another task, the whole
subtask - its INVOKING SUBTASK, the called task's own steps, their commands
and output - stays inside the calling step's band, so you can see the call
hierarchy at a glance instead of a flat wall of lines:
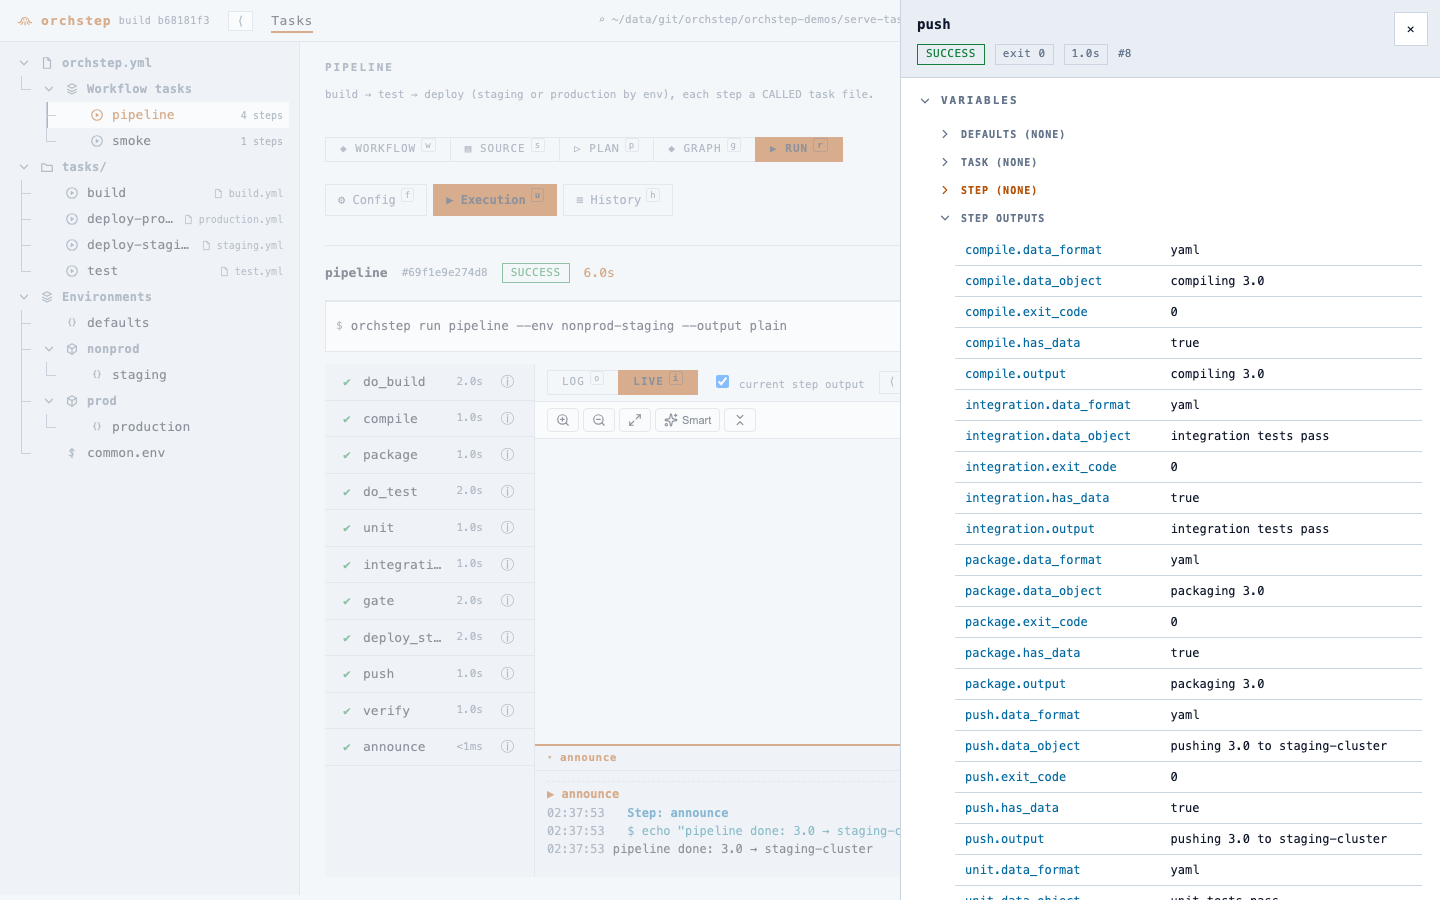
The header shows the run id, a status badge, the elapsed time, and the exact CLI command that produced the run. Because the full pipeline is seeded up front, a failure shows its blast radius: the failed step goes red and every step that never ran is marked skipped, so you see exactly where it stopped and what it took down with it.
Click the ⓘ on any step (or Shift-click it) to inspect that step's runtime context - the variables it saw, its environment, its outputs, and its logs - drilled down from the run's collected data.
Previewing before you run: PLAN and GRAPH
You do not have to run anything to see what would happen. The GRAPH tab shows the resolved dry-run plan: it descends into called tasks and loaded modules, renders each command, resolves condition verdicts (which branch is taken), and marks runtime-only values with placeholders.
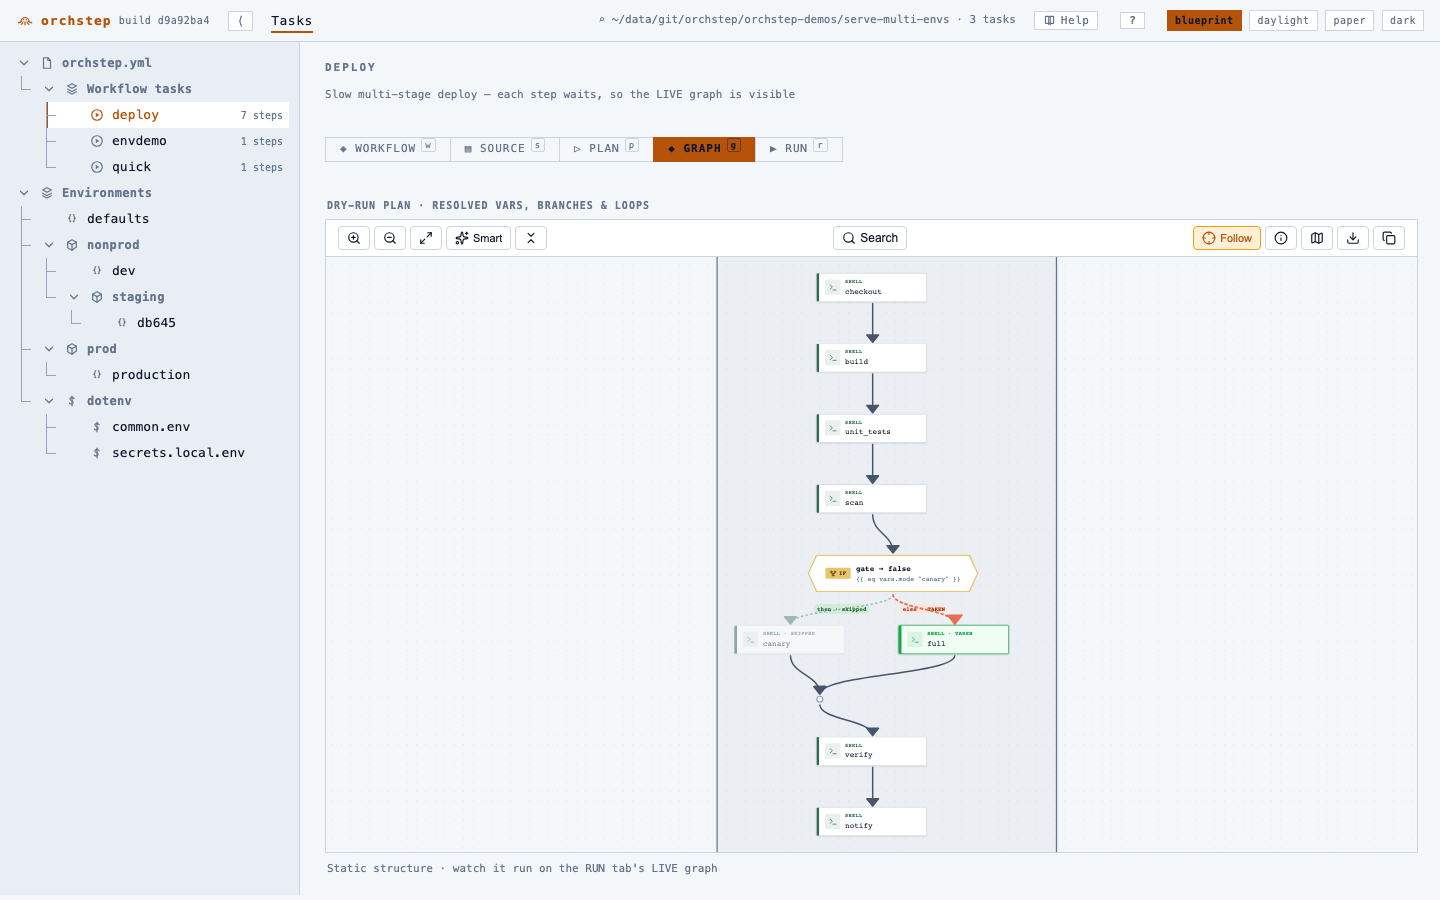
This is the same engine-faithful plan that orchstep run <task> --dry-run --open
produces. See Previewing with Dry Run for the full story.
History
Every run is recorded - status, task, the command, when, and duration - so you can glance at what happened and click back into any run's logs and graph.
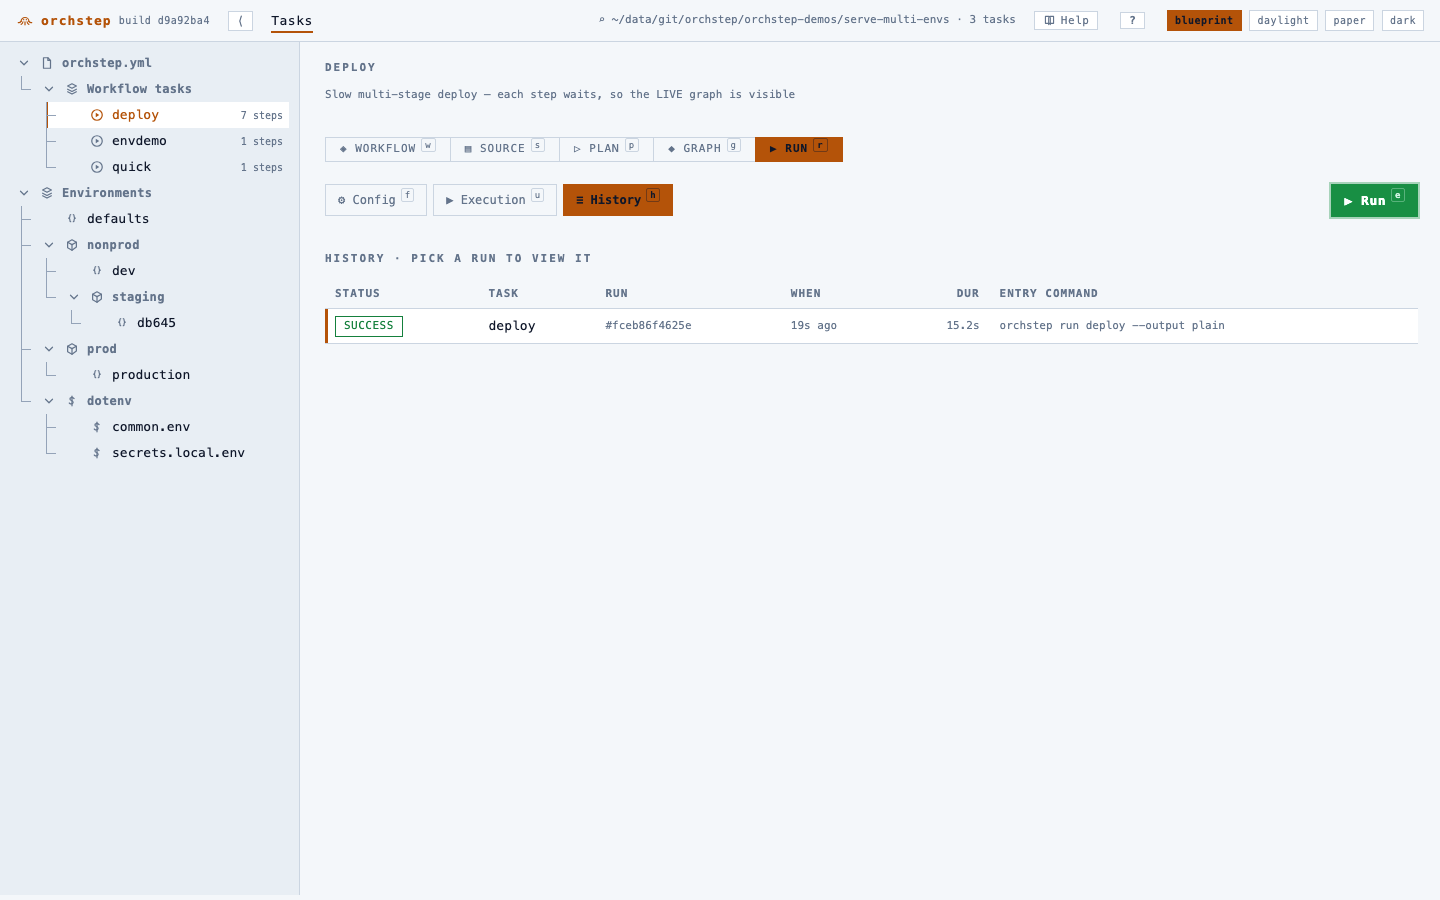
History is a single SQLite file (.orchstep/serve.db by default). Nothing
phones home; delete the file and the history is gone. Saved run commands sit in
the left rail for one-click re-launch.
Switching workflows
The header path is also a browser. Click it to walk the filesystem and load any
other project that contains an orchstep.yml, without restarting the server.
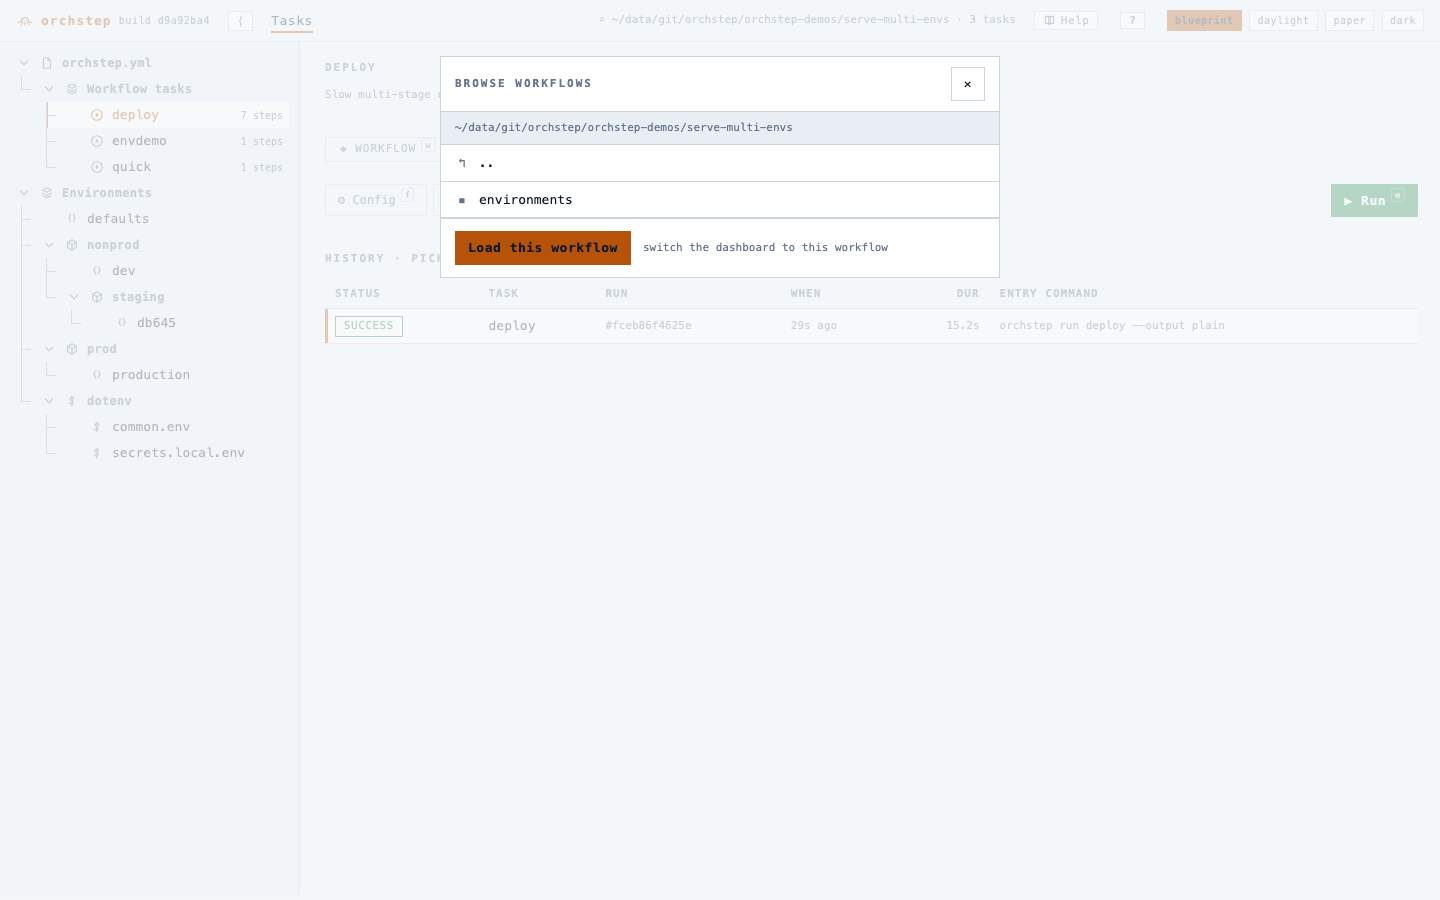
Browsing is gated to loopback or --allow-browse, since reading host files is
only safe locally.
Help and version
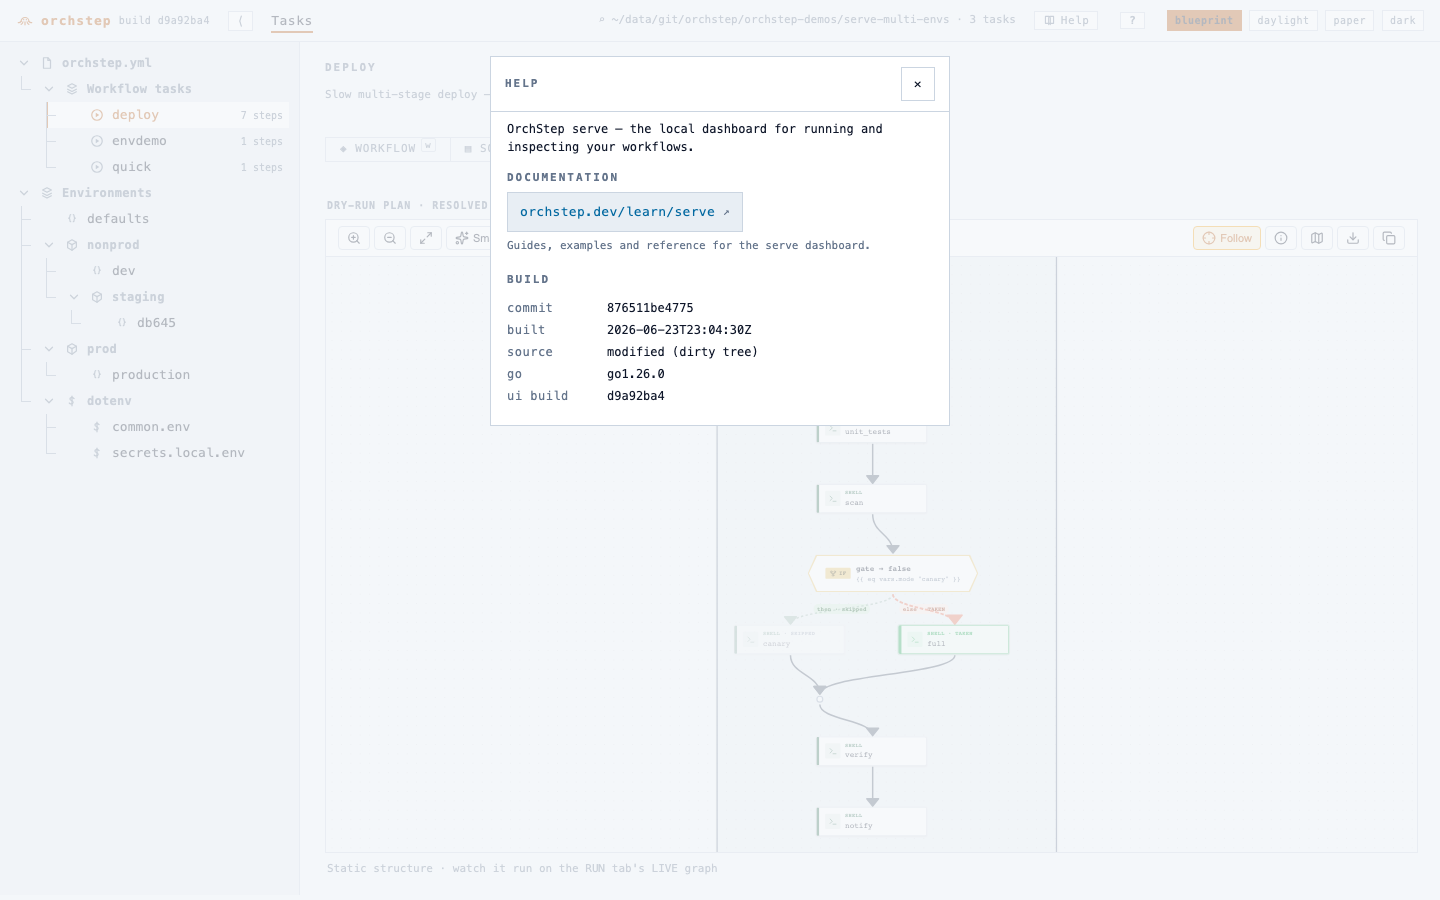
The Help button (top-right) opens a small page with a link to this documentation and the binary's build info - version, git commit, build date, Go runtime, and the UI build hash - so you always know exactly what you are running.
Keyboard shortcuts
Press ? any time for the full overlay. The essentials:
| Keys | Action |
|---|---|
w s p g r | Switch tab: Workflow / Source / Plan / Graph / Run |
f u h | Run sub-tab: Config / Execution / History |
o i | Execution view: Log / Live |
e | Execute (run) the current task |
x | Cancel the current run |
j k / | Next / previous task, or find a task by name |
c t | Cycle theme / toggle the file panel |
Sharing it with your team
By default serve is local-only - 127.0.0.1, no auth, for you. To put it on a
shared box for a small team, bind a routable address and require a token on
every request:
orchstep serve --host 0.0.0.0 --port 7777 --token "$(openssl rand -hex 16)"Then everyone hits http://that-host:7777/?token=.... This is deliberately
simple - a shared token, not user accounts - meant for a trusted team network,
not the public internet.
Flags
| Flag | Default | What it does |
|---|---|---|
--port | 7777 | Bind port. |
--host | 127.0.0.1 | Bind host. Use 0.0.0.0 with --token for LAN sharing. |
--token | (none) | Shared token required on every request. Opt-in auth. |
-f, --file | orchstep.yml | Workflow file to serve. |
--db | .orchstep/serve.db | SQLite store path for run history. |
--allow-browse | (off) | Allow the filesystem browser / source view off loopback. |
The HTTP API
The UI is just a client of a small JSON + SSE API, so you can script the dashboard or wire it into other tools:
| Method & path | Purpose |
|---|---|
GET /api/workflow | Tasks, resolved variables, environments. |
GET /api/source | A file's YAML in block and flow form. |
GET /api/plan | The resolved dry-run plan (env/var-aware). |
GET /api/validate | Static env x variable coverage matrix. |
GET /api/version | Binary build / version info. |
GET /api/browse | List a directory, flagging workflow folders. |
POST /api/runs | Start a run: {"task":"deploy","vars":{...}}. |
GET /api/runs | Run history. |
GET /api/runs/{id} | One run with its steps. |
GET /api/runs/{id}/events | SSE stream: log and step events. |
POST /api/runs/{id}/cancel | Cancel a running task. |
# Kick off a run from a script and follow it
RID=$(curl -s localhost:7777/api/runs -d '{"task":"deploy"}' | jq -r .id)
curl -N localhost:7777/api/runs/$RID/eventsWhere to go next
- Example projects - clone and run
the
servedemos shown here (serve-multi-envs,serve-task-calls, …) - Your First Workflow - if you do not have an
orchstep.ymlyet - Previewing with Dry Run - the deep, descend-everything plan view that the GRAPH tab shows
- Variables & Outputs - the precedence the run builder's variable panel reflects
- Environments - the env groups and per-env files the environment selector drives